Pseudo Anonymous Hit Counter: Review of 2018
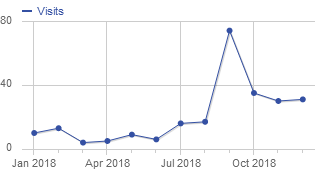
The entire reason this post, and by extension the previous PAHC post were made is because of what happened on 2018-08-14.
I didn’t notice it until October, when I checked the numbers in Piwik, but the August 14th article about the School Board of Education meeting has been 13.2% of this years traffic. While not that large a number, disregarding the front page (at 24.6%), the next highest view percentage is 2.6% (2018-09-19 Planning Board). After that the numbers drop quickly (a pair of 1.7% and a whole lot under 1%).
Raw Numbers
Before I get into the numbers, worth noting a few details. First, counts are for ‘visitors’, which doesn’t directly match to ‘people’. A person may visit multiple times over the year. Second, generally only focus on the most frequent numbers, so if things don’t add up that’s why.

In 2018, my website (dannybassette.com) and it’s sub-domains (ofal and drat) had 250 visitors, who collectively viewed 606 pages. Of those 250 visitors, 183 use desktops and 56 used smartphones (51 of those smartphones being Apple iPhone’s). Of those 183 desktops, 112 were running Windows 10 and 35 were running Windows 7.
Microsoft Edge was the most popular browser, used for 76 visits. Google Chrome had 54, Mozilla Firefox 40, and Apple Safari 35.

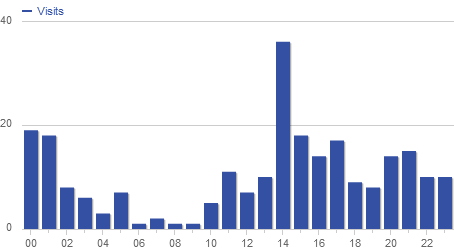
The 2PM hour was by far the most popular, although there was a decent turnout much of the rest of the day. While 2AM to 10AM was low, there was still activity in that time block.

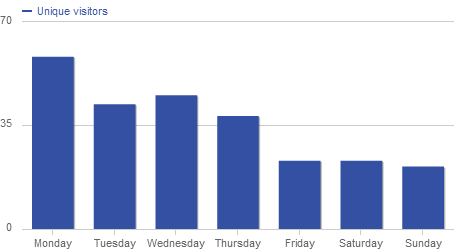
Monday was the busiest day, but not by much. Rest of the week was in two tiers: Tuesday/Wednesday/Thursday as a higher group with Friday/Saturday/Sunday as a lower group.
Of the 250 visitors, 215 were from North America, 204 being United States, 11 Canada. 20 countries in total visited, but apart from those two, all the rest were single digits (most being just 1).
Of the US’s 204 visitors, 179 were from New York, 8 California. Canada’s 11 were 8 Quebec and 3 Ontario.
New York’s 179 visitors broke down as 70 from Warsaw, 39 Rochester, and 20 Honeoye Falls.
149 page views of the front page (dannybassette.com) directly. 290 for 2018 content, 50 for 2017. The 2018-08-14 BoE non-meeting had 80 visits, making it the second highest page viewed (only beaten by the front page). 6 visits to the link from Dad’s Christmas letter, and 2 fbclid (which means links from Facebook).
Speculations
From those numbers I can make a number of speculations. The first is that a number of people at the school were looking for information on a meeting that did not happen at it’s regular time and place (2018-08-14 BoE). The spike of traffic at the end of the school day (2PM), that so much of it shares three IP addresses (all in Warsaw), how many of the ‘visitors’ hit that page and only that page, all imply a group of people at a single location. Looking at the subject matter, I assume that group is school staff.
The amount of traffic late at night was higher then I would have expected. I would have expected the overlap of ‘people awake in the early AM’ and ‘people caring to read my writings’ to be zero. Instead it is near zero.
That Monday had the highest traffic implies people are reading about that nights meeting shortly after I post it. Or maybe that’s the day a particular link was shared.
I’m assuming the traffic from other countries are people using TOR, VPN, or similar tools. Canada and California were more interesting. They are scattered in both time and IP range. Maybe I have a fan that travels? Maybe the bot filtering is off?
I’m assuming the location data is a little off, and that much of the Warsaw/Rochester traffic is actually happening closer to Honeoye Falls. After all, I show up as being in Lima, while I am actually in Honeoye Falls.
Of course, all this is speculation, so I could be wrong on any or all.
Conclusions
Overall, much more traffic then I expect. Which isn’t a bad thing, the function of a website is to share. That so many people cared about a meeting that I didn’t get to was rather surprising.
That anyone on Facebook had shared a link to my site was amusing.
It would have been interesting to see what other data could have been gained. 250 ‘visitors’, but is that 5 people or 50? How often does the same person come back? As nice as knowing more would be, I can’t justify that sort of tracking.
Overall, the traffic has gradually trending up, and after a spike it looks to have leveled off. We’ll see what it does next year.
